
AI that reads steel mill shift reports and finds the hidden losses
Shift leads at North American Stainless write what went wrong in free text. We built a working prototype that reads those reports, finds repeat failures and missed work orders, and hands each finding to a named owner with its source.
- Manufacturing · Steel
- AI prototype
- 2026
The answers are in the reports. Nobody has time to read them.
Every line at the mill files Short Interval Control (SIC) reports each shift: delays, fixes, leaks, safety notes. Most of the useful signal sits in free text, and forms with yes/no boxes miss it.
Read more
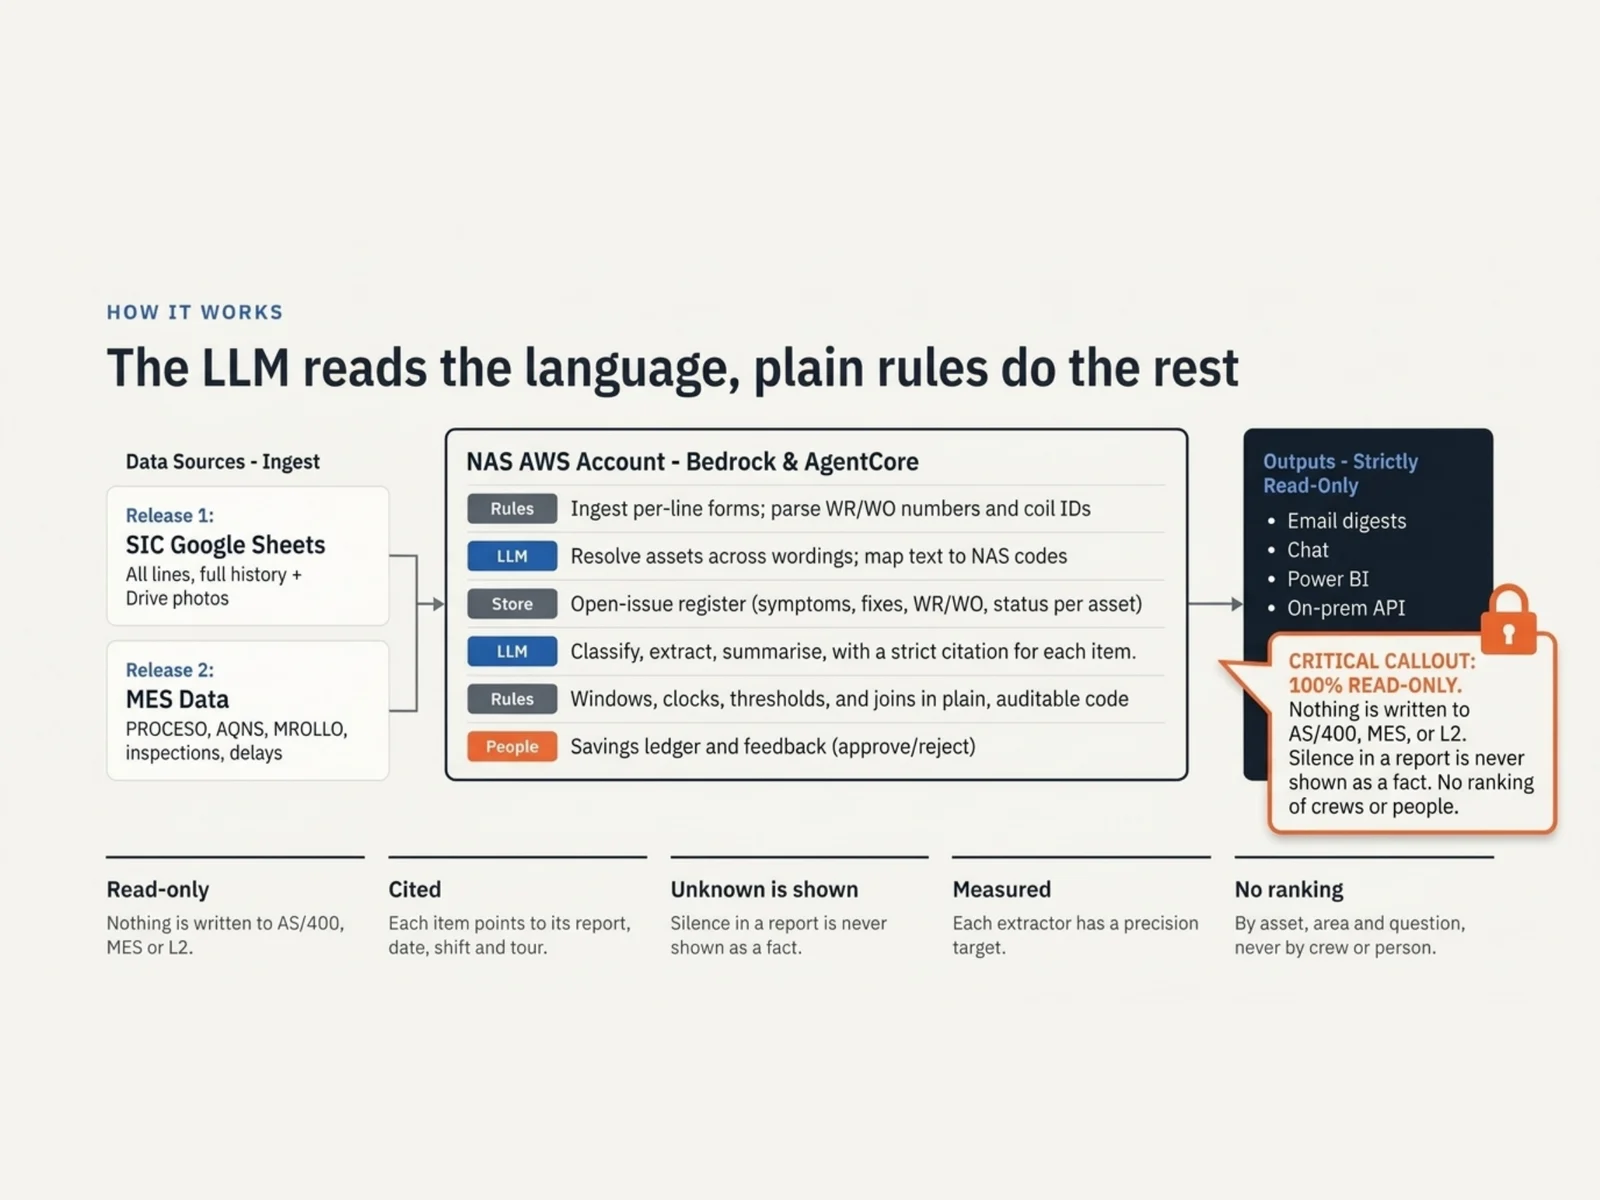
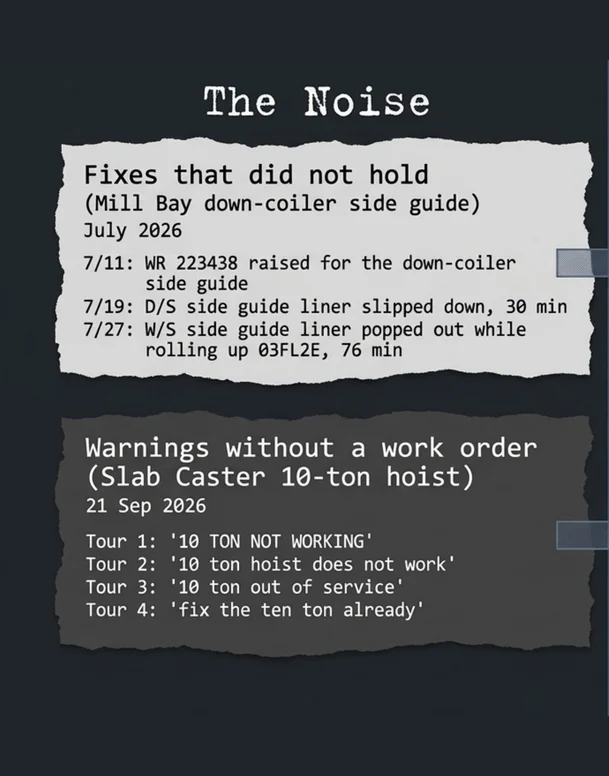
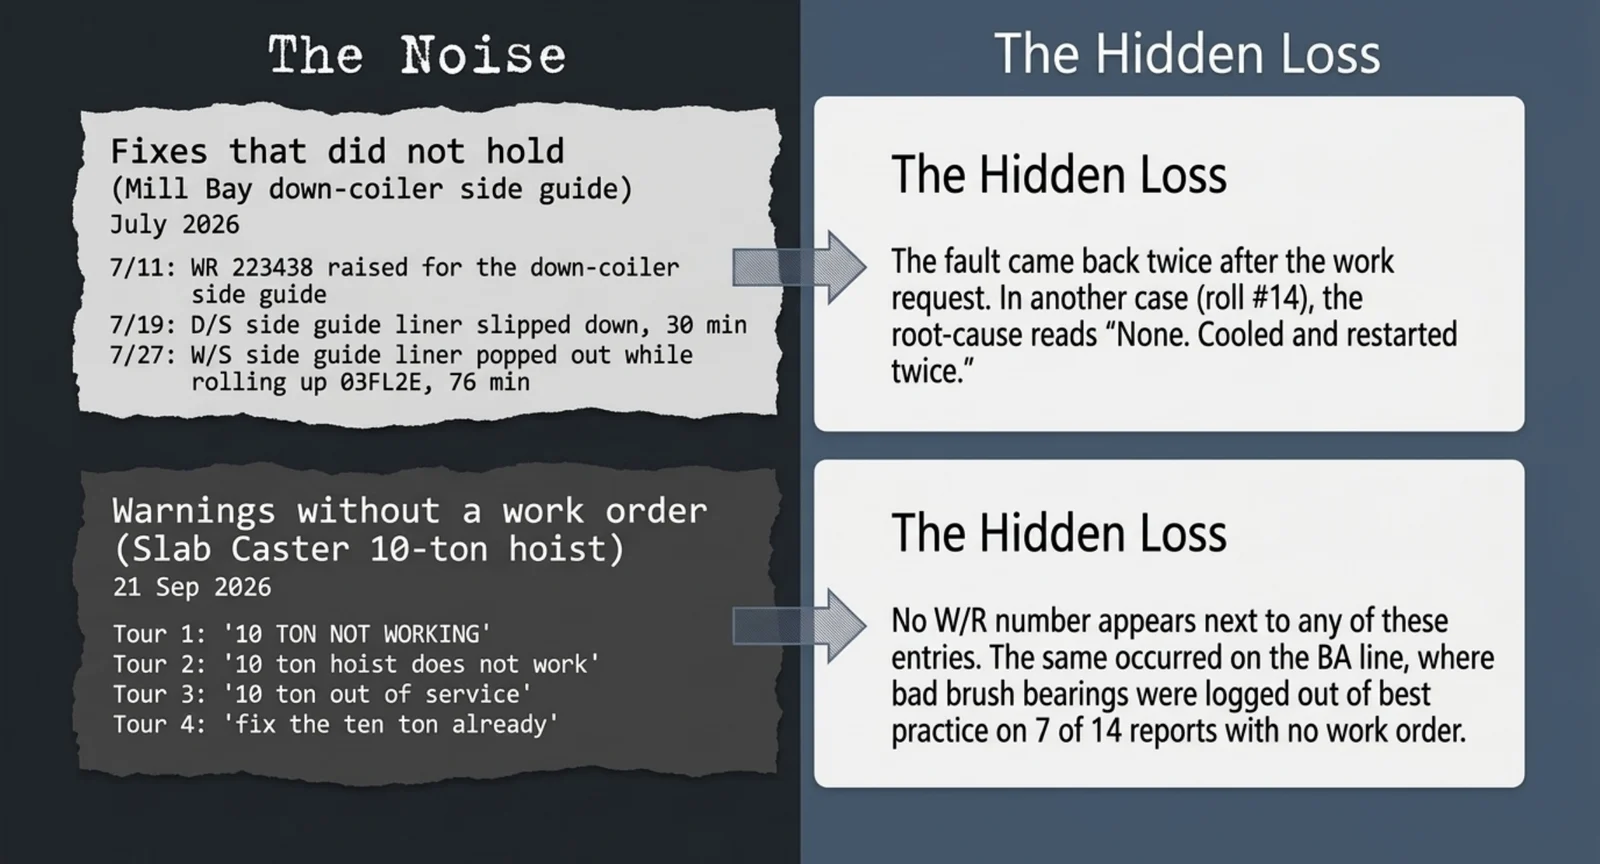
Reading the Mill Bay record for July 2026, we found the same patterns again and again:
- 01
Fixes that did not hold
A work request was raised for a down-coiler side guide on July 11. The liner slipped again on July 19 and popped out on July 27, costing 76 minutes.
- 02
Warnings without a work order
Four tours in a row on one day logged the slab caster hoist: "10 TON NOT WORKING" through "fix the ten ton already". No work request number appears next to any of them.
- 03
Leaks handled by topping off
"Oil was 5+ inches deep creating a hazard walkin thru the cellar." The forms do not total top-offs per asset, so chronic leaks stay hidden.
- 04
Severe events the boxes do not show
A report described steel sprayed everywhere and catching fire, while the safety incident box said No.
Seven capabilities, each with an owner
Release 1 runs on SIC data alone. Release 2 adds read-only MES data. Every capability delivers a list, a draft or a flag to a named owner.
Read more
- 01
Repeat-failure review
Did the fault come back after a recorded fix? A weekly list for the maintenance planner.
- 02
Fault-response memory
What was tried last time on this fault? On-demand chat for shift leads and on-call techs.
- 03
Top-off ledger
Which assets are topped off again and again, a sign of hidden leaks.
- 04
Severe-event flag
Free text that describes a severe event, whatever the yes/no boxes say, goes straight to safety and the shift manager.
- 05
Suspect-coil queue
Coils that passed through the line during a fault, mapped for QA review.
- 06
Event dossier
A cited 30-day history of a major stop, assembled for the root-cause owner.
- 07
Field value audit
Which form fields carry no signal. One Mill Bay efficiency field was blank on 63 consecutive reports.
The LLM reads the language, plain rules do the rest
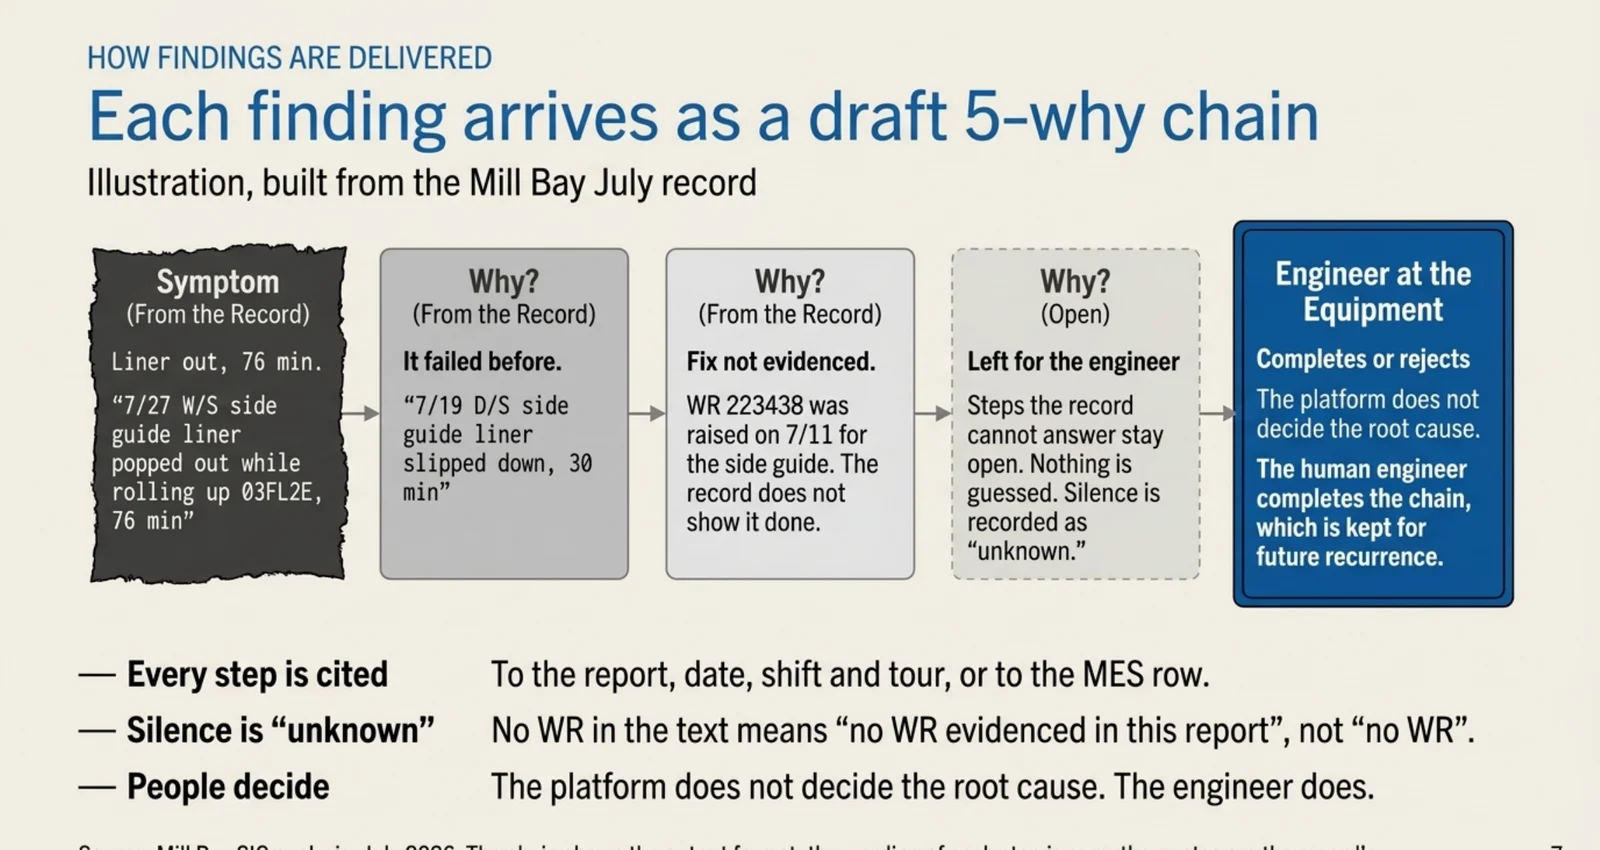
The reports arrive as PDF files. The model does only what needs language: it resolves assets written many different ways, then classifies, extracts and summarises with a citation for each item. Time windows, thresholds and joins run as plain, auditable code.
Read more
- 01
Read-only
Nothing is written to the AS/400, MES or Level 2 systems.
- 02
Cited
Every item points to its report, date, shift and tour.
- 03
Unknown is shown
Silence in a report is never shown as a fact. No work request in the text means no work request evidenced, not none.
- 04
People decide
The platform does not decide the root cause. The engineer does.
- 05
No ranking of people
Findings are grouped by asset, area and question, never by crew or person.
It runs inside the client's own AWS account on Amazon Bedrock and AgentCore, and delivers email digests, chat, Power BI views and an on-prem API.
A business case sized on the mill's own data
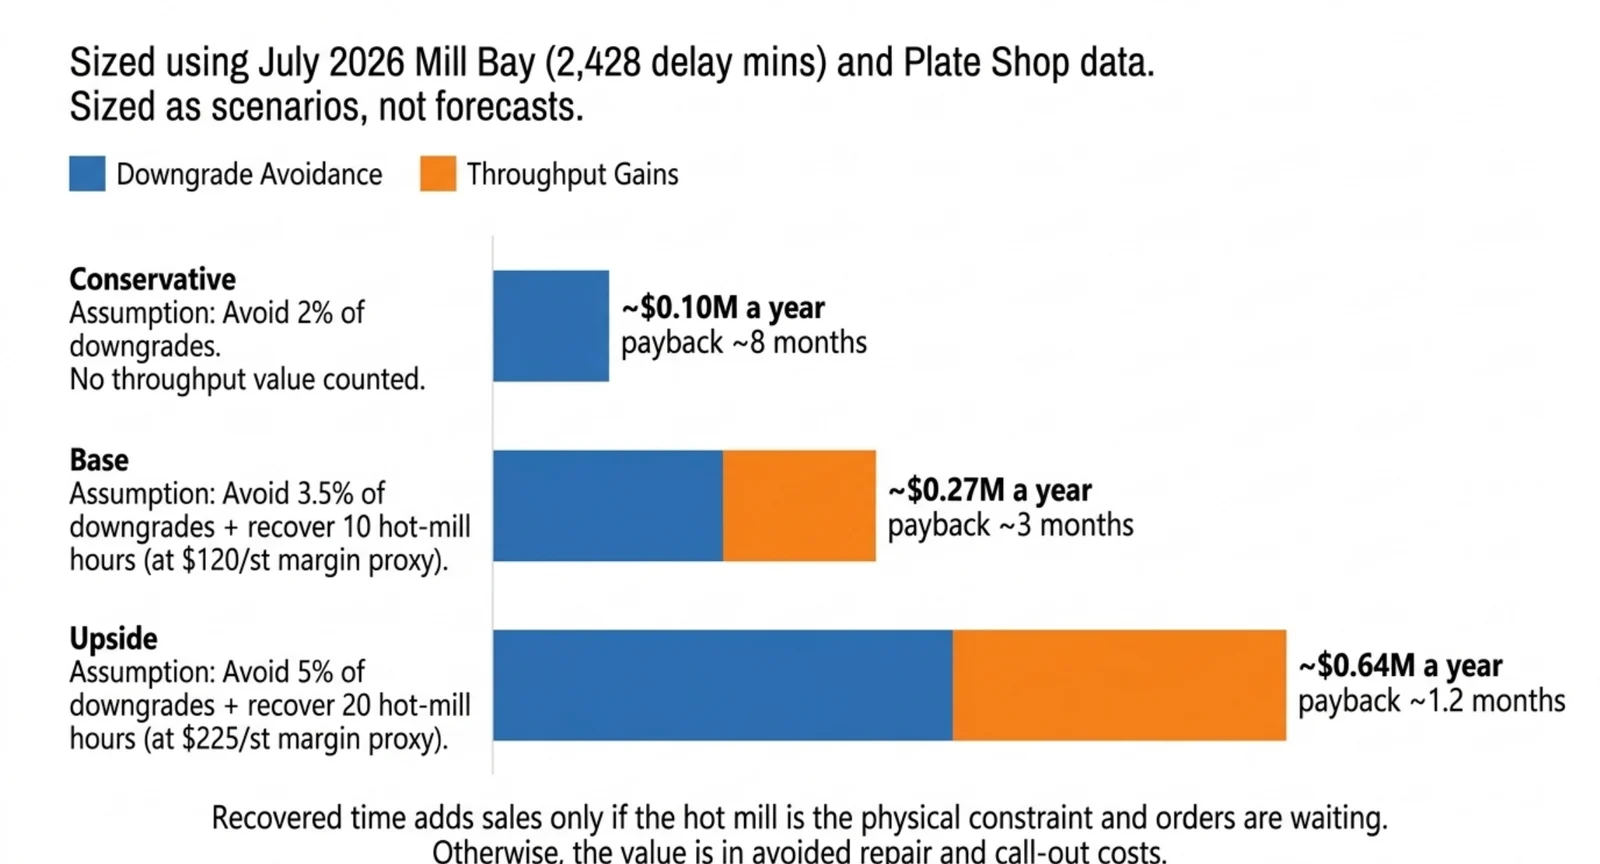
We sized the value from loss pools in the mill's own reports, as scenarios rather than forecasts: about $0.10M a year in a conservative case, $0.27M in the base case and $0.64M in the upside case.
Read more
The plan starts with a short setup phase that measures the return on real data and ends with a go/no-go decision, so the mill only pays for the next phase if the numbers hold.
AI where your people already write things down
If your plant logs shifts, inspections or tickets in free text, the signal is already there. We can prototype on your own records, read-only, and show what it finds before you commit to a build.
Tell us the outcome.
We will write your case study
Discovery in two weeks. ROI proposal after. Public case study optional, by your choice.